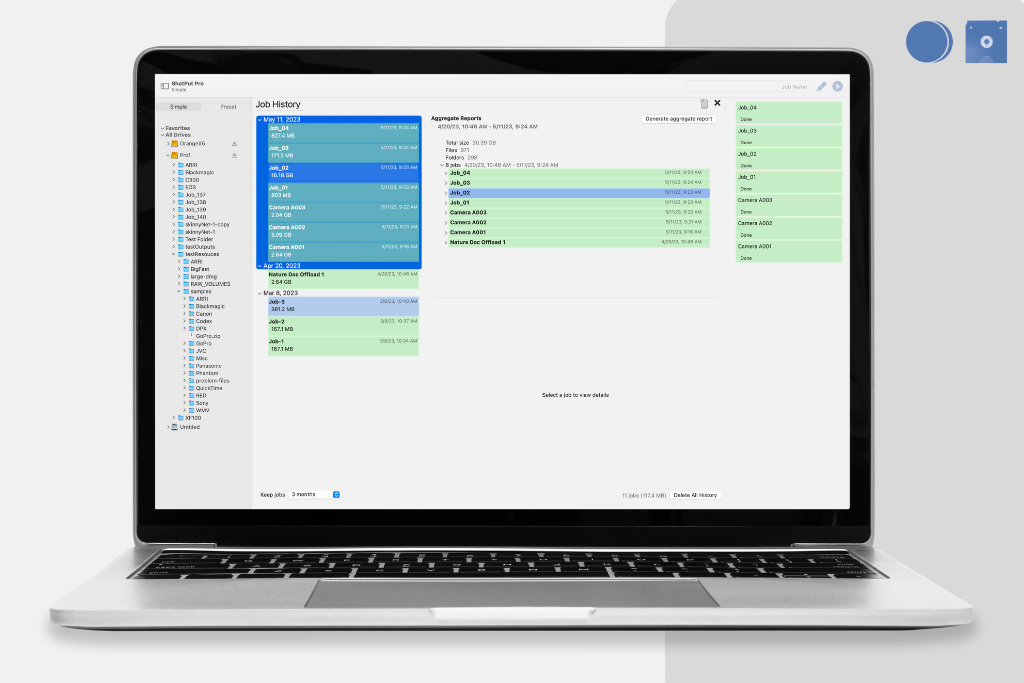
Aggregate Reporting has just arrived to both ShotPut Pro and myLTO! This feature has been heavily requested, so we are extremely excited that it is officially available to all users. In addition to this, we have also added the ability to re-run media analysis, allowing you to generate thumbnails and reports for a job after it has already been completed. Read on (or check out this video) to learn more about these powerful features and how you can use them to save time and stay organized!
Job History
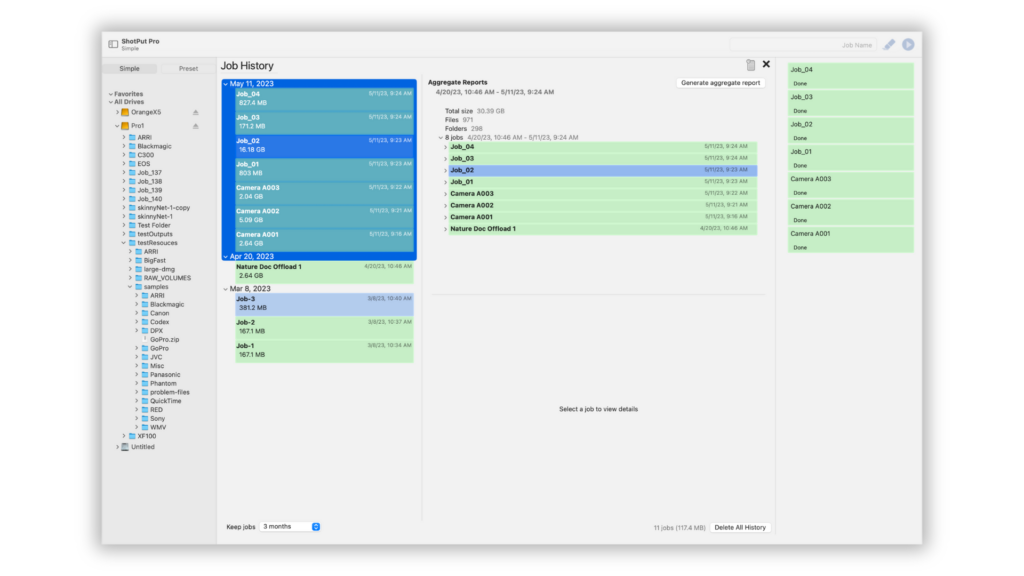
Both of these features are located in the Job History page. To find this page, head to the top menu bar and locate the History tab, and from there, select View Job History. If you’re unfamiliar with this page, you can check out our FAQ or tutorial video that briefly go over all of its components.

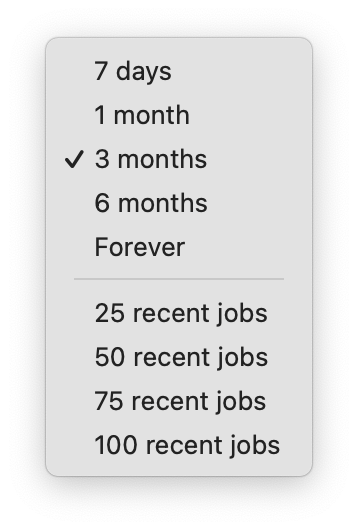
The first thing that you’ll see when arriving at this page is a list of all of your completed jobs. How long these jobs are kept is completely up to you. Options include keeping a specific number of jobs (up to 100) or keeping jobs from a set time period (7 days to Forever).

Selecting Your Jobs
From the list of completed jobs select a custom range using Shift+Click or a custom set by using Command+Click. The command click selection can also be used to make a custom selection of days.
 Upon selecting a day or range of jobs, the aggregate information appears in the upper panel to the right of your list of completed jobs. Some of the information given includes the range of time in which the jobs were run, the total size of all files, and the total number of files, folders, and jobs. Just like when a single job is selected, you can select any of these jobs to bring up its contents below. This view works in the same way, allowing you to select a specific file and view its metadata and thumbnails.
Generate the Report
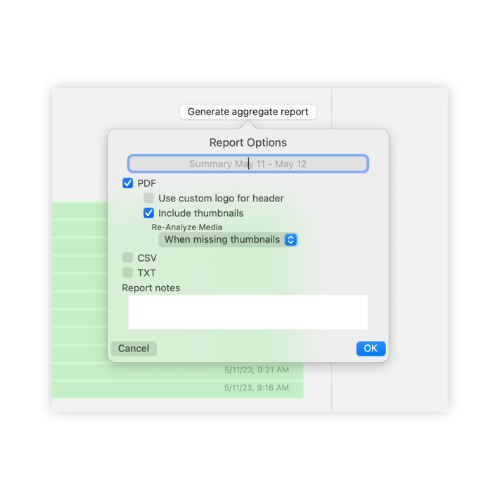
You now notice the button above says Generate Aggregate Report. Select this will have a pop-up appear. Its default title is Summary Report (range during which the jobs were run). You can change this title to anything you would like.

Next, you can select the different types of reports that you want to be included when generating reports. If you did not select one of these reports when first running your job, you can now select it here. This is also where you can Re-Analyze Media.
Re-run Media Analysis Options
For example, if I forgot to include thumbnail images in my PDF report when I initially ran my job, or perhaps I did choose to include them and they returned corrupted, I can select PDF from this list, and then choose Include thumbnails. After checking this box an additional pop-up will appear asking you to define when you want to re-analyze the media.
Selecting Always will collect new metadata and thumbnail images, even if this information is already present. This is the option you would choose if you had previously selected to include thumbnails, but they were corrupted or appeared incorrectly.
When Missing Thumbnails will only rerun the media analysis if there are no thumbnails found in the initial job. This is the option you would select if you did not include thumbnails in your initial job or if you did not originally generate a report at all.
The last option is to Never re-run media analysis. Using this option will create a PDF report but will only use known metadata information and thumbnails that were gathered originally.
Finishing Up
The other option in this view is to select whether or not you would like to use a custom logo in the header in place of the software logo. If this option is selected it will use the custom logo you have chosen in the Reports section of the General Settings.
The last option, aside from including CSV or TXT reports, is the Report Notes section. Here you can choose to include additional information in the report header such as production info, DIT details, the project name or anything else you would like to include to stay organized. Once everything is set, click OK, then choose a destination to send the report to. After that’s done, click the Report Icon above to view the progress of your report generation. Selecting the Eye Icon next to a completed report will then open its location in a new window where you’ll be able to select it and view the report.
As you can see this feature is extremely useful and is easy to navigate for experienced users and beginners alike. If you have any questions about this feature, or any others, feel free to reach out to our support team at support@imagineproducts.com!
2 Comments
Hi, is this coming for the Win version as well? would be very welcome.
Thanks!
Hi Simon,
We are currently working on a build that will help Windows become more feature similar to the Mac version. While this exact feature may not be in the initial release of that, it should be coming up in the development pipeline!
Best regards,